Why the same moisture reading means different things in January and July

A moisture survey answers the question “how wet is it today”. That is a useful question, but it is not the one most people are asking, which is “is this normal, and is it getting worse”. The second question cannot be answered without knowing the season, the time of day and what the structure did last year.
The short version. A reading has no meaning without its context. The sections below take that one story at a time: the seasonal rule for ventilated timber roofs, the daily moisture cycle inside compact roofs, and what both mean for when and how to measure.
The rule in one sentence
BYG-ERFA, the Danish foundation that publishes documented building experience, puts it this way in its guidance on ventilated, membrane-covered timber roofs with slopes up to 10 degrees - the roofs usually called flat: a wood moisture content of up to 20 % (by weight) measured in the coldest winter months is not considered alarming there, because the timber is in equilibrium with the outdoor air in the ventilated cavity; the same reading in the summer period calls for closer investigation. That is a rule about that roof type, not a general licence for 20 % in any timber element - in an unventilated build-up, or an element that should be at indoor equilibrium, the same number means something else. The sheet also gives the numbers behind its rule: it pairs 16 % wood moisture with about 75 % relative humidity, which it calls the limit for mould growth, and allows timber to be built into these roofs in spring and early summer at up to 20 %, corresponding to equilibrium at about 85 % RH, only if the conditions for drying follow.
Why: moisture follows the air
Two measurements are in play here, and they are not the same thing: wood moisture content is a share of the wood’s dry weight, while relative humidity describes the air around it. They connect through equilibrium. Wood settles towards the humidity and temperature that surround it, and BYG-ERFA’s guidance on moisture measurement notes that in an unheated loft the relative humidity runs up towards 100 % in winter and down to about 30 % in summer, so the timber in it is wettest in late winter and driest in late summer. Its moisture content does not jump; large cross-sections take months to reach equilibrium, and wood that has been wet holds more moisture at a given humidity than wood that has been dry - the US Forest Products Laboratory puts that hysteresis at up to about 3 percentage points.
The bridge between humidity rules and moisture rules is an equilibrium table, and the tables differ by source and species. The Forest Products Laboratory’s table puts wood at about 20 °C near 16 % moisture at 80 % RH and near 20 to 21 % at 90 %; the Danish sheet pairs 16 % with about 75 % and 20 % with about 85 %. The direction is the same in every table - higher air humidity, higher equilibrium moisture - but the exact pairing belongs to a source and a species, which is one more reason to read a threshold together with its context. The mould research behind today’s models is not an on/off number either: it describes roughly 75 to 80 % relative humidity as a lower critical range, and only under sustained conditions, with temperature, duration and material deciding the rest.
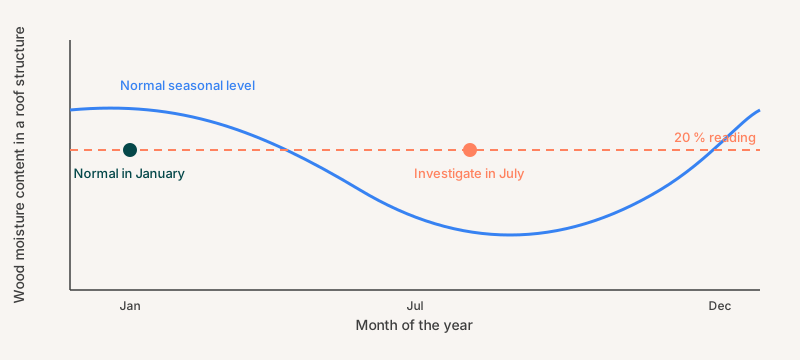
One reading, two seasons. The level is the same; its meaning depends on where the normal curve is. Schematic.
Inside a warm roof: a summer day and a winter month
Warm, compact roofs make the seasonal swing a daily one as well. Fraunhofer IBP built a test roof with construction moisture at its Holzkirchen field site in 2006: a glass-wool warm roof with about two litres of water per square metre deliberately added before it was closed. In the six analysed months from August 2006 to January 2007, the relative humidity at the top of the insulation in late summer swung between about 20 % at midday and 100 % at night (the same dark membrane was later measured at around 70 °C on sunny days); from mid-November it stayed at 100 %. The moisture moved downwards by day and upwards by night, and in winter it collected under the membrane. In the team’s simulations of the same roof, validated against those measurements, the drying potential under the dark membrane exceeded that under a white one by a factor of two or more: a white or shaded surface keeps the roof cooler and slows its drying. BYG-ERFA’s warm-roof guidance describes the practical consequence: even small amounts of moisture in the insulation can produce drips through the ceiling on a hot day, as solar heat drives the moisture down to where it condenses, and those drips are easily mistaken for a membrane leak. Read more on the mechanism in moisture in warm roofs during summer and on what happens next in why condensation in flat roofs spikes in autumn.
A calendar for surveys
The measurement guidance is explicit about timing. Moisture in roof structures is normally highest in February and March, so a measuring programme that cannot run for a year or two should at least cover those months. Moisture in flat-roof insulation varies over the day with solar radiation, so a scan made after a sunny morning reads differently from one made at dawn. A new compact roof carries a further caveat: in a SINTEF study of two new Norwegian roofs monitored from installation, the built-in construction moisture kept the humidity sensors at very high humidity, where they read unstably, for roughly the first seven to eight months, and the monitoring system’s producer analysed the readings manually instead of sending automatic alerts until they settled. That is worth knowing before a handover survey is taken as proof that a roof closed dry - and before the first months of any monitoring are read as alarms.
What this means for reading data
None of this argues against measuring; it argues against comparing a reading to a number alone. Compare it to the same month last year. Compare it to the neighbouring sensors: a leak usually shows at one or two positions, while seasonal and weather-driven changes tend to move many - though not necessarily in step, because insulation, shading and position differ across one roof. Compare it to the weather, because a rise that follows rain and a rise that follows sunshine are different events. A one-off survey can see the spatial differences on the day and can be read against that day’s weather; what it cannot establish is whether a position is becoming wetter over time, or how this July compares with last July. A continuous record can, given what each comparison needs: enough history behind the sensor for last year to exist, neighbouring sensors close enough to the position in question, and weather data for the site. With those in place it turns “20 %” into “20 %, in July, at this outlet, up from 14 % since the storm”. How the system works explains the four steps from sensor to decision.
Sources
- BYG-ERFA (27) 130605, Tagkonstruktioner med lille hældning - ventilation og fugtforhold.
- BYG-ERFA (99) 21 06 17, Fugtmåling i træ og tagkonstruktioner.
- BYG-ERFA (27) 100322, Varme tage - efterisolering og fugtforhold.
- Bludau, C., Künzel, H. M. and Zirkelbach, D. (2010). Hygrothermal Performance of Flat Roofs with Construction Moisture. ASHRAE, Buildings XI proceedings.
- Asphaug, S. K., Geving, S. and Moschetti, R. (2024). Development of smart control system for leakage warning in compact roofs. Journal of Building Physics 48(3), 391-419; conference version J. Phys.: Conf. Ser. 2654, 012096.
- Wood Handbook - Wood as an Engineering Material. USDA Forest Products Laboratory.
- Simpson, W. T. (1998). Equilibrium Moisture Content of Wood in Outdoor Locations in the United States and Worldwide. USDA Forest Products Laboratory, Research Note FPL-RN-0268.
- Hukka, A. and Viitanen, H. (1999). A mathematical model of mould growth on wooden material. Wood Science and Technology 33, 475-485.