Why one wood moisture reading can mislead
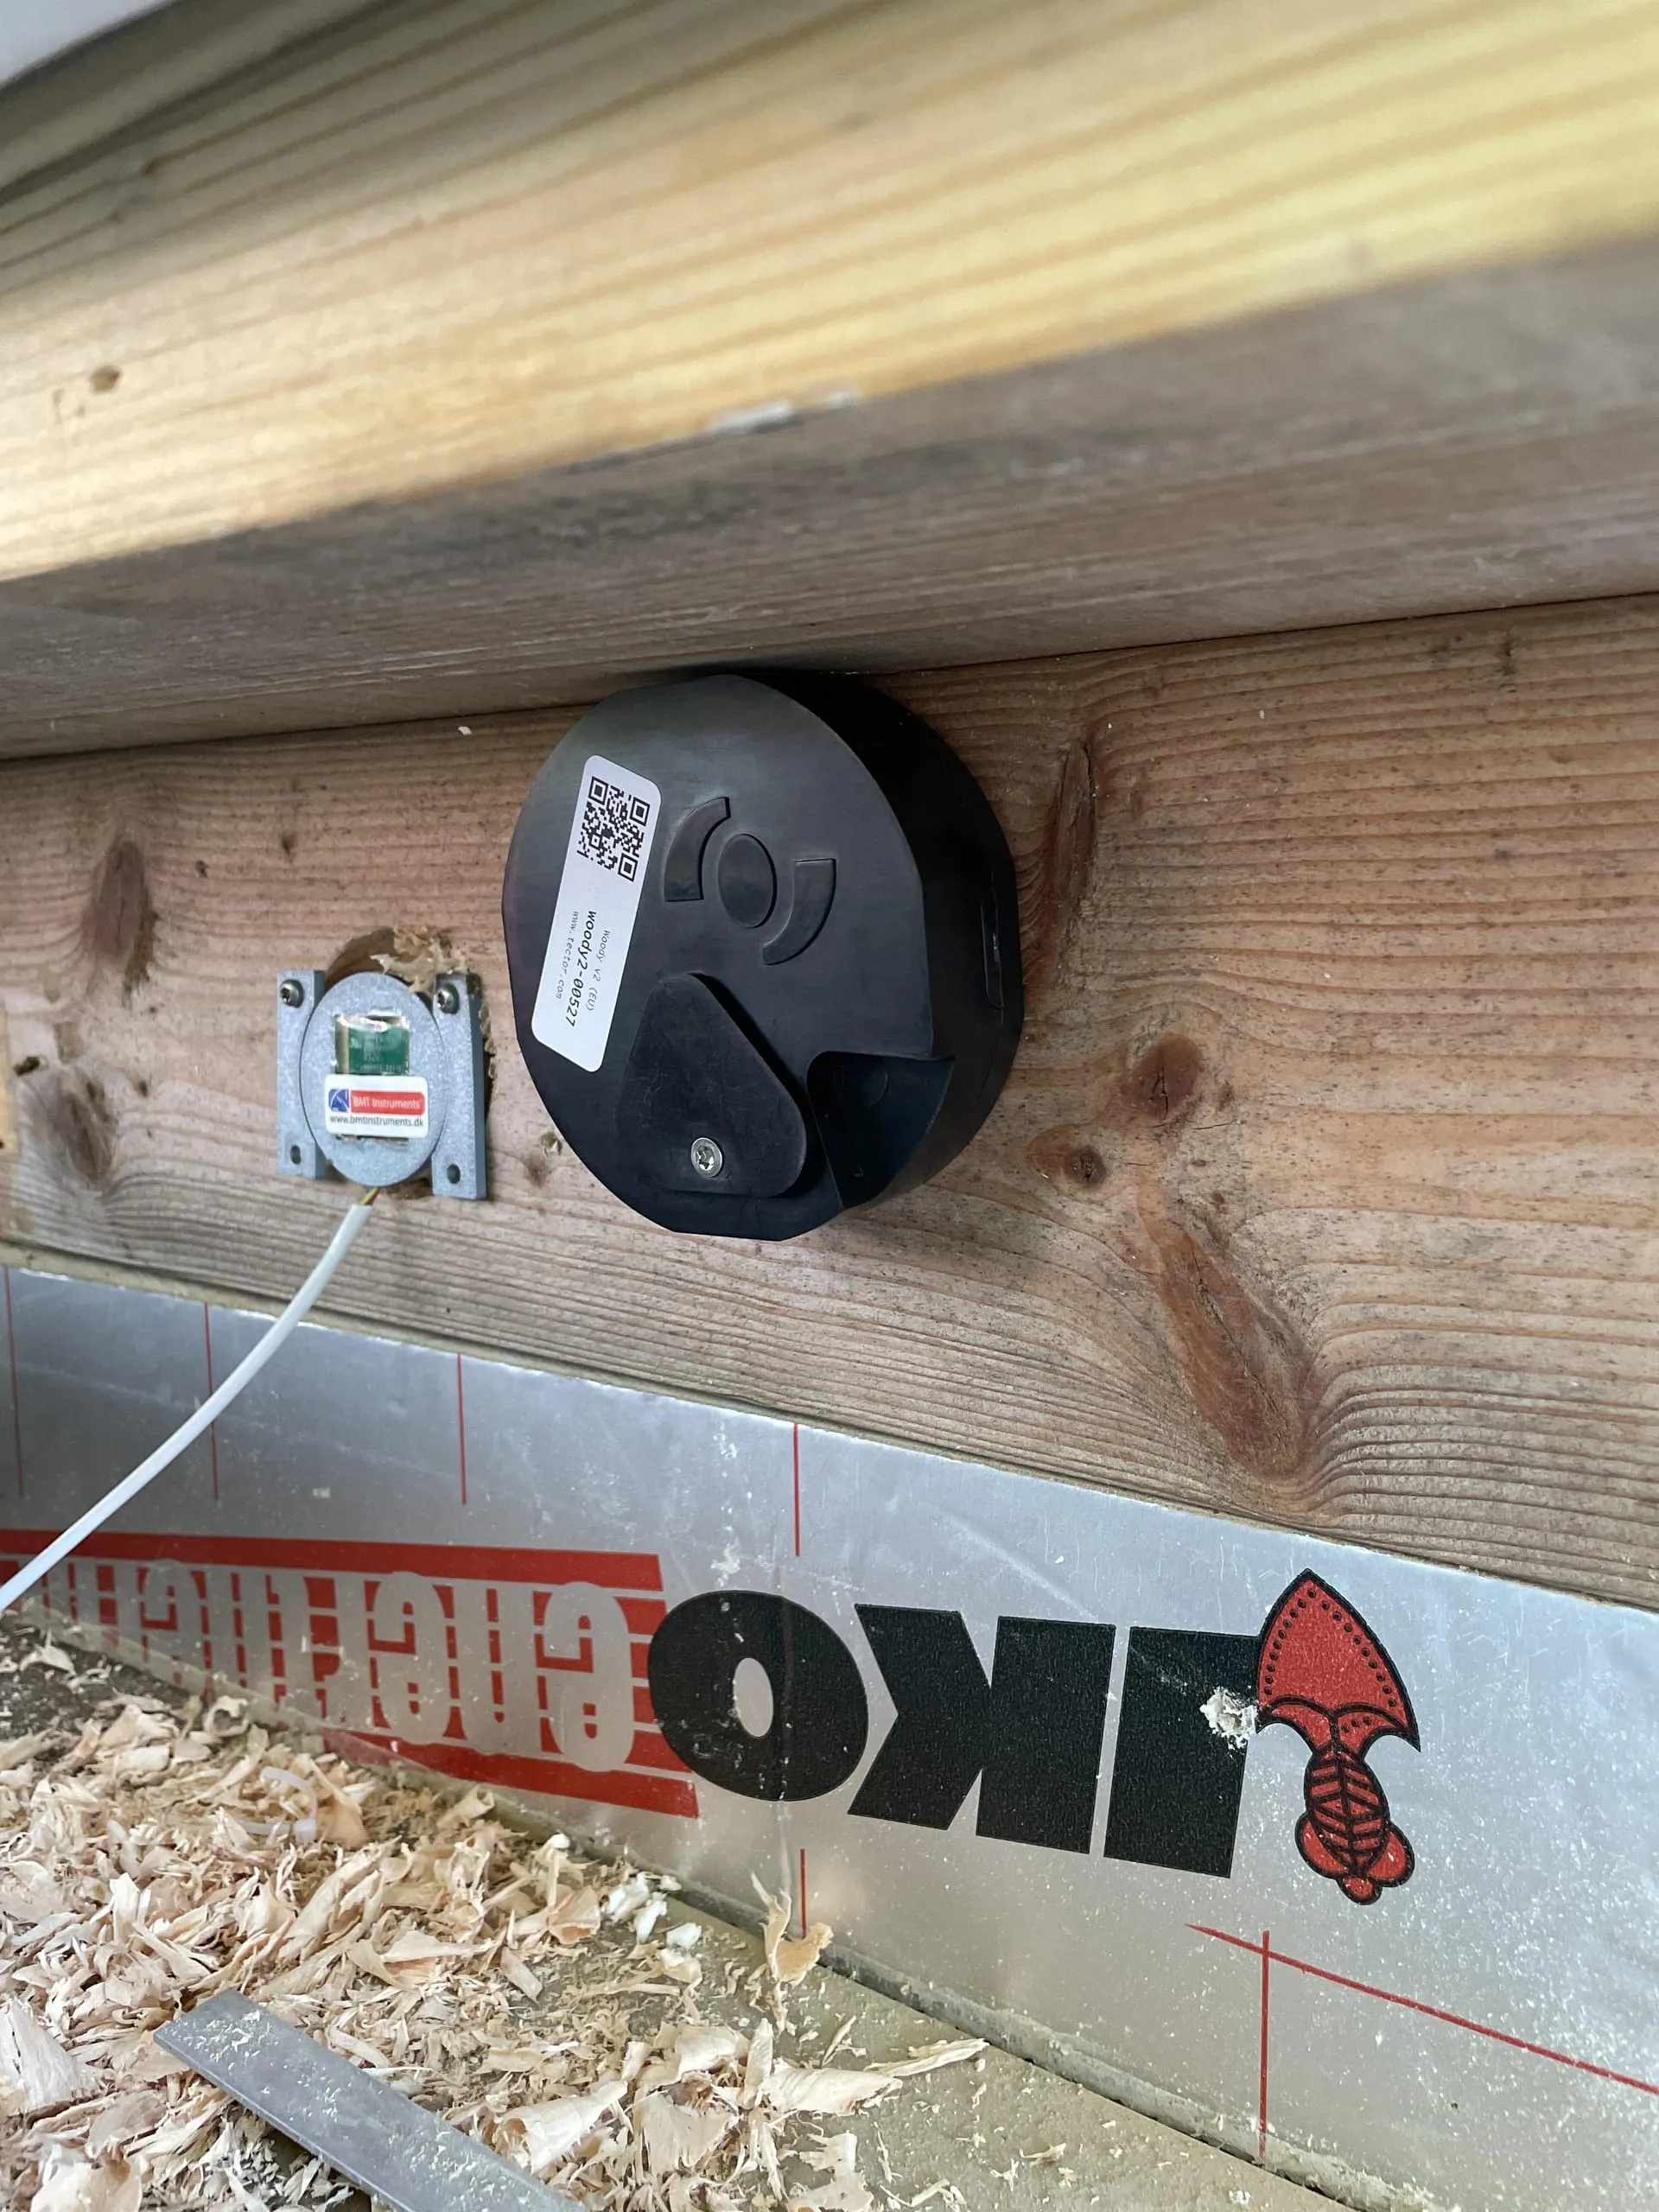
Most disagreements about timber moisture on site are not about whether the meter worked. They are about what the number meant. This article walks through what independent research says about measuring wood moisture by electrical resistance, and what changes when the electrodes stay in place and report continuously. It is about the method, not about any particular meter.
The short version. A meter or sensor measures electrical resistance; the moisture content is estimated from it. Four things decide how much to trust the estimate: the wood’s temperature, its species or product, where the electrodes sit, and time - one reading against the history around it.
The resistance is real; the moisture content is an estimate
A resistance instrument measures one thing directly: the electrical resistance between two electrodes. The moisture content on the display is an estimate, produced by a conversion curve that assumes a species, a temperature and a moisture distribution. So a reading can mislead without the instrument being at fault - the measurement was valid, but one of the assumptions behind the conversion was not.
When the assumptions hold, the estimate is good. Resistance rises steeply as wood dries, so steeply that the practical lower limit of a resistance meter is around 6 to 7 % moisture and its useful range runs to about 30 %; below fibre saturation the logarithm of resistance falls almost linearly as moisture rises. Alfred Stamm described that relationship in 1927 and stated its accuracy: on wood with uniform moisture and a known temperature, within about one percentage point. A Spanish calibration study of ten hardwoods in 2012 reached the same plus or minus one point and added the sentence that matters: the expected error “is applicable only when the piece of wood under inspection is environmentally fully conditioned and its temperature is accurately known and its effect compensated for.” The physics allows one point. What follows is the list of assumptions that take it away.
Temperature
Warm wood conducts better than cold wood at the same moisture. The Finnish research centre VTT, in the largest independent test of moisture meters (22 instruments, about 2,700 specimens from seven countries), measured the correction at about 0.1 to 0.15 percentage points of moisture per degree Celsius. The Forest Products Laboratory’s rule of thumb is the same in other units: conductivity roughly doubles for every 10 °C, so subtract about one point for every 20 °F the wood is above the calibration temperature. Worked through, a reading taken on a panel at 5 °C in February and compared with one at 25 °C in July carries a two- to three-point difference that has nothing to do with water. That is larger than the whole accuracy the method can offer, which is why a sensor that does not also measure temperature at the same position - Tector’s sensors measure it in the air immediately above the wood, as a proxy for the wood’s own temperature - cannot correct for it.
Species, origin and engineered wood
Different woods conduct differently at the same moisture. For North American species the Forest Products Laboratory puts the correction at usually under two points; across a wider range, a common calibration leaflet that groups timbers into species scales shows the same resistance reading corresponding to moisture contents about six points apart between groups. Origin matters too: VTT found that the curves for pine from Finland, Sweden, Norway and Germany were close to each other, while maritime pine from France differed clearly; an earlier South African study found that meters calibrated for a European pine did not give the required accuracy on radiata and maritime pine grown there. Engineered wood is its own case. A New Zealand test of LVL framing found an uncorrected resistance meter reading about six to seven points high, a reading of 20 corresponding to a true 13 %, and attributed the offset to the adhesive. The lesson for CLT and glulam is not a number; it is that the conversion curve has to belong to the product being measured.
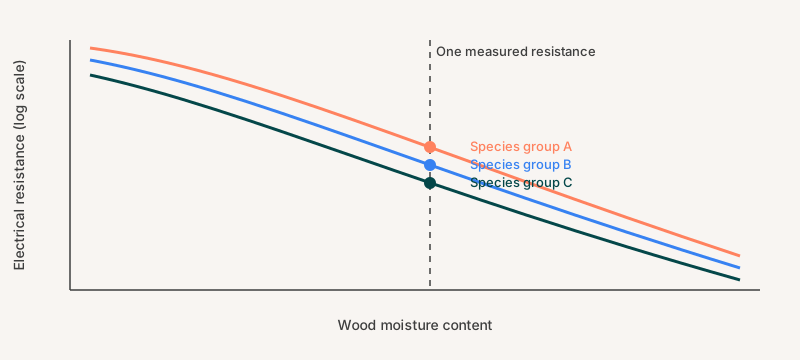
The same resistance, read on three species curves, gives three moisture contents. Schematic.
Where the pins are
Pin electrodes are driven in from one side, and the Forest Products Laboratory’s reference on moisture meters is precise about what they then measure: practically all the current flows through the wettest layer of wood that is in contact with both pins, usually right at their tips, and if the wettest wood at one pin is drier than at the other, the drier of the two limits the current and sets the reading. The distance between the pins has no practical effect. The reading therefore describes conditions at the tips, at the depth they were driven to, not an average of the piece - which makes depth a decision, not a detail. For timber that has been drying steadily, the laboratory’s rule places the pins at one-fourth to one-fifth of the thickness, where the moisture is close to the average of the cross-section. Insulated pins, bare only at the tip, exist because surfaces mislead: on timber wet from rain or dew, uninsulated pins read the surface film rather than the wood, and even insulated pins fail when free water follows them into the hole.
Measuring across a gradient instead of at a chosen depth behaves differently again. Stamm dried a piece of Sitka spruce until its surface sat at 2.8 % moisture over a core at 25 %, then measured through the thickness: the piece averaged nearly 20 % but read 7.7 %, because in that arrangement the layers lie in series and the driest ones dominate. That is a caution about surface electrodes across a drying gradient, not about pins, and it is one more reason the resistance method uses pins at a defined depth. Danish practice guidance adds the rest of the list: measure at several places, because moisture varies within one piece; align the electrodes along the grain; keep away from end grain, knots and fasteners; and expect salts to mislead. Its own examples are fire-retardant-treated pine that read 23 % on a resistance meter against 16 % by oven-drying, and de-icing salt that produced a reading of 34 %.
Lab versus site
Put these together and the gap between the method’s accuracy and a meter’s accuracy is no surprise. VTT’s result for resistance meters was plus or minus 1.5 to 2.5 points on well-conditioned material in the laboratory and plus or minus 2 to 5 points in industry. In the typical case, 45 to 50 % of readings fell within one point of the oven-dry value. Below about 10 % moisture the readings of every resistance meter tended to creep, and the Danish guidance gives the practitioner’s version for handheld pin meters: typically up to 10 % deviation from the measured value. The Forest Products Laboratory’s list of what limits accuracy has eleven entries, and most of them are about the situation and the operator rather than the instrument: species, density, moisture distribution, thickness, temperature, electrode contact, grain direction, chemicals, weather, adequacy of the sample, and the care or skill of the person holding the meter.
Two different numbers hide in this, and both are honest. A stated instrument accuracy describes the device under specified conditions: conditioned wood, known temperature, the right calibration curve. The uncertainty of an estimate made on a site adds everything above on top - species, gradients, installation and treatments. When a device specification and a field study seem to disagree, they are usually answering those two different questions.
What a time series controls, and what it does not
Now fix the electrodes in the wood at a known depth, measure the temperature at the same spot, use a curve for that product, and read continuously. The entries on that list that come from the act of measuring become constants: the same position, the same depth, the same grain direction, the same contact, no operator, no weather on the pins. That is what a fixed time series controls - the variation a handheld spot check adds each time someone takes a reading.
It does not make the absolute number correct. The species or product calibration still has to be the right one, a moisture gradient through the element means the reading describes the depth the electrodes sit at rather than the whole cross-section, treatments and salts still bias the reading, and wood at the same humidity still holds a little more moisture drying than wetting. Those sit in the absolute value whether the sensor is fixed or handheld. What a time series changes is which question the data can answer well.
Two findings explain why. Researchers at Lund University, who built small resistive sensors for permanent installation in timber structures, found that changes in moisture content in an individual specimen were monitored more precisely than the absolute value, and that the method was useful up to about 50 % moisture even though the absolute error grew above 20 %. A Danish study from DTU in 1990, of wooden measuring dowels left in structures for years, pointed the same way: a falling moisture reading was treated as the dependable sign that a structure is drying out. Neither finding makes the trend infallible - resistance also moves with temperature, electrode contact and chemistry, so a trend is only as trustworthy as the temperature correction and the stability of the installation behind it. With those in place, changes over time can generally be read with more confidence than the absolute estimate.
The contractor on the Faroe Islands’ first CLT building discovered this in practice. The team began with random sampling by hand alongside the installed sensors, and then dropped it: the sensors gave the same answer continuously, and the daily readings went straight into the quality-assurance system that decided when it was safe to insulate or paint.
The standards behind the method
None of this is exotic, but the standards are narrower than they are often quoted. EN 13183-2 standardises the resistance method for estimating the moisture content of sawn timber, in roughly the 7 to 30 % range, with the oven-dry reference in EN 13183-1 and the capacitance method in EN 13183-3; in Denmark they apply as DS/EN 13183. EN 14081-1 covers strength-graded structural timber with a rectangular cross-section and requires the producer’s moisture meters to be calibrated annually. Neither standard covers permanent monitoring, CLT or other engineered products as such - there the same physics applies, but the calibration has to belong to the product. A specification can still name the standards for what they do cover, and ask the questions that matter for any product: how temperature and species are corrected, at what depth the electrodes sit, and how often the reading is taken. How Tector’s sensors are specified, including their measuring range and the conditions the figures apply to, is on the sensor page; the difference between a spot reading and a monitored element is laid out in Tector versus moisture meters.
Sources
- Stamm, A. J. (1927). The Electrical Resistance of Wood as a Measure of Its Moisture Content. Industrial and Engineering Chemistry 19(9), 1021-1025.
- James, W. L. (1988). Electric Moisture Meters for Wood. USDA Forest Products Laboratory, General Technical Report FPL-GTR-6.
- Forsén, H. and Tarvainen, V. (2000). Accuracy and Functionality of Hand Held Wood Moisture Content Meters. VTT Publications 420.
- Fernández-Golfín, J. I. et al. (2012). Curves for the estimation of the moisture content of ten hardwoods by means of electrical resistance measurements. Forest Systems 21(1), 121-127.
- Simpson, I. (2015). Moisture Meter Correction Factors. Scion, New Zealand Forest Research Institute.
- BYG-ERFA (99) 21 06 17, Fugtmåling i træ og tagkonstruktioner.
- Fredriksson, M. et al. (2013). Small resistive wood moisture sensors: a method for moisture content determination in wood structures. European Journal of Wood and Wood Products 71, 515-524.
- Fugtmåledybler (1990). Instituttet for Husbygning, Danmarks tekniske Højskole.
- EN 13183-1/-2/-3 and EN 14081-1 (in Denmark DS/EN).