From reading to risk: how continuous moisture data is turned into a risk score
A moisture reading is a fact about one point at one moment. Whether that point is at risk is a different question, and it cannot be answered from the reading alone. Mould and decay need humidity, temperature and time together, and they need them in the material, not in the room. The first half of this article is about the research: what published mould and decay models say about those conditions, and why duration and temperature matter. The second half is about the product: what Tector’s mould curves, flat-roof Risk Score and alerts each do with continuous readings. The models explain the why; they are not the algorithm inside the score, and the article keeps the two apart.
Why a reading is not a risk
Take a relative humidity of 85 % measured inside a roof build-up. On a July afternoon, after a week of rain, that may be the roof doing what warm roofs do in summer. Held for six weeks in October, at a cool deck, it is a different story. The number is the same; the risk is not. What separates the two is how long the condition has lasted, at what temperature, and in what material. No single reading carries that information.
What mould actually needs
One of the mould models used in building physics comes from VTT, the Finnish research centre. Hukka and Viitanen’s 1999 model expresses mould growth on wood as an index from 0 (no growth) to 6 (full coverage) that rises or falls with three inputs: relative humidity at the surface, temperature, and time. Growth is possible between about 0 and 50 °C. The humidity it needs depends on temperature: about 80 % RH above 20 °C, higher when it is colder, and at low humidity and low temperature the latent period before anything appears is measured in weeks. Two details matter most for reading data. First, the model’s own authors say that “all values below 1 indicate no growth” - the first stage is microscopic, not visible. Second, the index is not a simple accumulation of wet hours: in the model, dry periods pause growth and can reduce the modelled index. A short humid period may add little modelled growth, and later dry conditions can delay further development - but drying does not remove mould that has already formed. The model was calibrated primarily on pine and spruce sapwood and on short unfavourable cycles; its authors note that long seasonal cycles are less well represented.
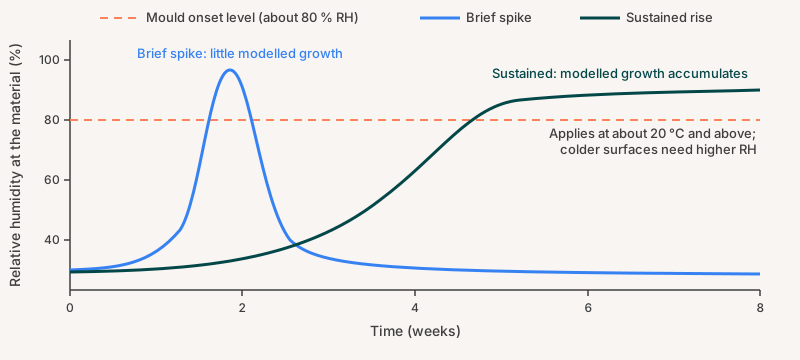
The same onset level, two different histories. The brief spike adds little modelled growth; the sustained rise accumulates it - and drying does not remove mould that has already formed. Schematic.
Material matters
In 2007 Viitanen and Ojanen extended the model to other building materials and exposed them for a year. After twelve months at 78 to 80 % RH, no growth was found on any of them. Above 90 % RH and 15 °C, all of them were susceptible. The threshold depends on what the surface is: wood-based materials from about 80 % RH, concrete from about 88 to 90 %, and clean mineral wool or EPS only above about 97 to 98 % and only after months of exposure. Dust changes the rules: organic dust on an otherwise resistant surface brings its threshold down to that of wood. The authors describe the extension as a simplified approach, tested on clean, new materials - they warn that the results should not be generalised to moisture-damaged or contaminated ones. Their summary is still the sentence every alert designer should keep: “fast changes in humidity conditions are reflected slowly by the corresponding response of microbial growth.”
Decay is a slower dose
Rot fungi need more than damp air: decay generally requires sustained, very high wood moisture with water available in the wood, commonly near or above fibre saturation. Fredriksson’s 2019 review puts the minimum for wood-degrading fungi at a water potential that corresponds to about 97 to 99.9 % relative humidity in equilibrium terms. The European CLICKdesign research (Brischke and colleagues, 2021) expresses decay as a cumulative exposure dose built up from each day’s moisture and temperature, and found that for Scots pine sapwood and Douglas fir heartwood a dose equivalent to about 325 days of favourable conditions preceded the first slight attack in long-running field tests. Days count unequally - a warm, wet day contributes far more than a cool, damp one - and the exact figure is species- and exposure-specific, not a design rule. The shape of the finding is the point: decay is a budget spent slowly or quickly, not a switch that flips on a wet afternoon. Tector’s platform does not compute this dose; the research is here because it explains why time, not the instantaneous reading, carries the risk.
Measure the material, not the air
A Norwegian study of four mould models (Lie and colleagues, 2019) tested which input predicts mould best on timber claddings under transient wetting. Humidity measured at the wood surface gave the best predictions; humidity of the ambient air gave the worst. The models that worked with hourly data beat the one that worked with twelve-hour averages. For predicting mould on timber surfaces, two conclusions follow: measure at the material rather than in the room air, and measure often enough to see the cycles.
The roof problem: what normal looks like
Compact roofs make this harder, because their normal is extreme. Fraunhofer IBP built a test roof with deliberately added construction moisture - about two litres of water per square metre - at its Holzkirchen field site. In the six analysed months from August 2006 to January 2007, relative humidity at the top of the insulation swung in late summer between about 20 % at noon and 100 % at night, and sat at 100 % from mid-November as the moisture collected under the membrane. Danish practice guidance for warm roofs (BYG-ERFA) adds that even small amounts of moisture can produce drips in summer as solar heat drives it downwards, and that those drips are routinely mistaken for a membrane leak. And in a SINTEF study of two sensor-monitored new compact roofs, built-in construction moisture held the humidity sensors at very high humidity, where they read unstably, for roughly the first seven to eight months - with the researchers noting that leaks from construction errors could hide behind it.
So context decides, and so do units. A high relative-humidity reading at one position in January may be part of normal seasonal redistribution in that roof; a high moisture reading in the material in July, when the build-up should be at its driest, can point to retained or incoming water. Read against the wrong baseline, either produces the wrong alert. Read against the right one, a leak tends to show as a rise that follows rainfall at one or two positions, while condensation tends to move several positions at once - though not in lockstep, because insulation, thickness and solar exposure differ across one roof.
What Tector’s platform does with this
Tector’s sensors report moisture, humidity and temperature from inside the structure, continuously. One precision up front: the temperature is measured in the air immediately above the material and used as a proxy for the material’s own temperature. A common misconception is that the sensor measures the temperature of the wood itself; it does not, and the distinction matters when conditions are read against material-level models like the ones above. Three separate features are built on these series.
The mould curves
The platform plots each sensor’s humidity and temperature against curves derived from the Finnish mould-growth model described above. Today that is a point-in-time picture: it shows whether a sensor’s current conditions sit in the range where mould growth becomes possible, not how long they have been there. The duration side - the dose the research describes - is read from the sensor’s history alongside the curves rather than computed into them.
The Risk Score for flat roofs
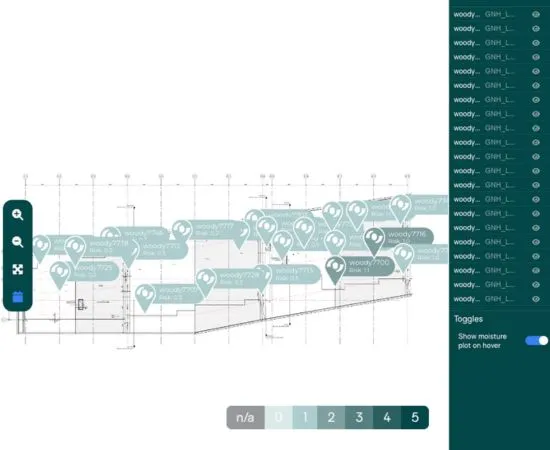
Two things about the current flat-roof sensors first. Unlike the first generation, which measured wood moisture content directly, the current generation measures the moisture content of a dedicated hygroscopic material with more favourable properties than wood for monitoring in the hot, sealed environment of a compact roof; the material and its use are part of Tector’s patent-pending design. The score then starts from the moisture level itself and adds weight for patterns rather than single values: a sudden jump in a sensor’s own series, a sustained rise (weighted differently in summer), a sensor that stops reporting - more so when it has rained in the previous 24 hours - very high humidity at the sensor, and a sudden jump on a neighbouring sensor within the blueprint’s effect radius, because water that reaches one position is often on its way to the next. The sum is smoothed so that a score falls back slowly rather than flickering. A sustained pattern moves the score; a single hot afternoon does not.
The alerts
Threshold alerts, which the user configures per sensor. Reference alerts, based on what sensors in a given area should not exceed. Mould-growth-risk alerts, driven by the curves above rather than by a single level. A leak alert for warm roofs, which triggers when a sudden jump in moisture suggests a possible leak - both of the following must apply: the sensor was dry throughout the previous 24 hours, and the moisture level then rose by at least 20 percentage points within the last 24 to 48 hours. And housekeeping alerts for missing values or a suspected faulty installation. The design goal running through them is the problem this article started with: a normal summer afternoon should not trigger an alert, and a sustained change should.
What the score does not do is claim certainty. It is a prompt to investigate from a named position and a dated trend, not a verdict on the roof. How well it does that is something we would rather show than assert; the measurement method, its range and its limits are described on the sensor page.
What to do with a rising score
Treat it the way the research suggests treating the underlying conditions: as a question about duration and position. Check whether the rise follows a rain event or a temperature swing. Compare the sensor with its neighbours; a leak often shows up at one or two positions while condensation tends to move several at once. Neither pattern settles it on its own - read it together with the weather over the same days, the sensor’s own history and what the neighbouring sensors did. Look at how long the condition has held, and whether it is building or recovering. On a roof within its defects period, this is the record that lets a contractor investigate a named detail instead of surveying the whole roof; the handover article covers that side. On a timber structure, it is the difference between “the reading was 19 %” and “the reading has been above 19 % since the storm and is still climbing”.
See how the Risk Score and the alerts work on a live roof: book a demo of the platform.
Sources
- Hukka, A. and Viitanen, H. (1999). A mathematical model of mould growth on wooden material. Wood Science and Technology 33, 475-485.
- Viitanen, H. and Ojanen, T. (2007). Improved Model to Predict Mold Growth in Building Materials. ASHRAE, Buildings X proceedings.
- Lie, S. K. et al. (2019). Can existing mould growth models be used to predict mould growth on wooden claddings exposed to transient wetting? Building and Environment 152, 192-203.
- Fredriksson, M. (2019). On Wood-Water Interactions in the Over-Hygroscopic Moisture Range - Mechanisms, Methods, and Influence of Wood Modification. Forests 10, 779.
- Brischke, C. et al. (2021). Modeling the Material Resistance of Wood, Parts 2 and 3. Forests 12, 576 and Forests 12, 590.
- Bludau, C., Künzel, H. M. and Zirkelbach, D. (2010). Hygrothermal Performance of Flat Roofs with Construction Moisture. ASHRAE, Buildings XI proceedings.
- Asphaug, S. K., Geving, S. and Moschetti, R. (2024). Development of smart control system for leakage warning in compact roofs. Journal of Building Physics 48(3), 391-419.
- BYG-ERFA (27) 100322, Varme tage - efterisolering og fugtforhold.